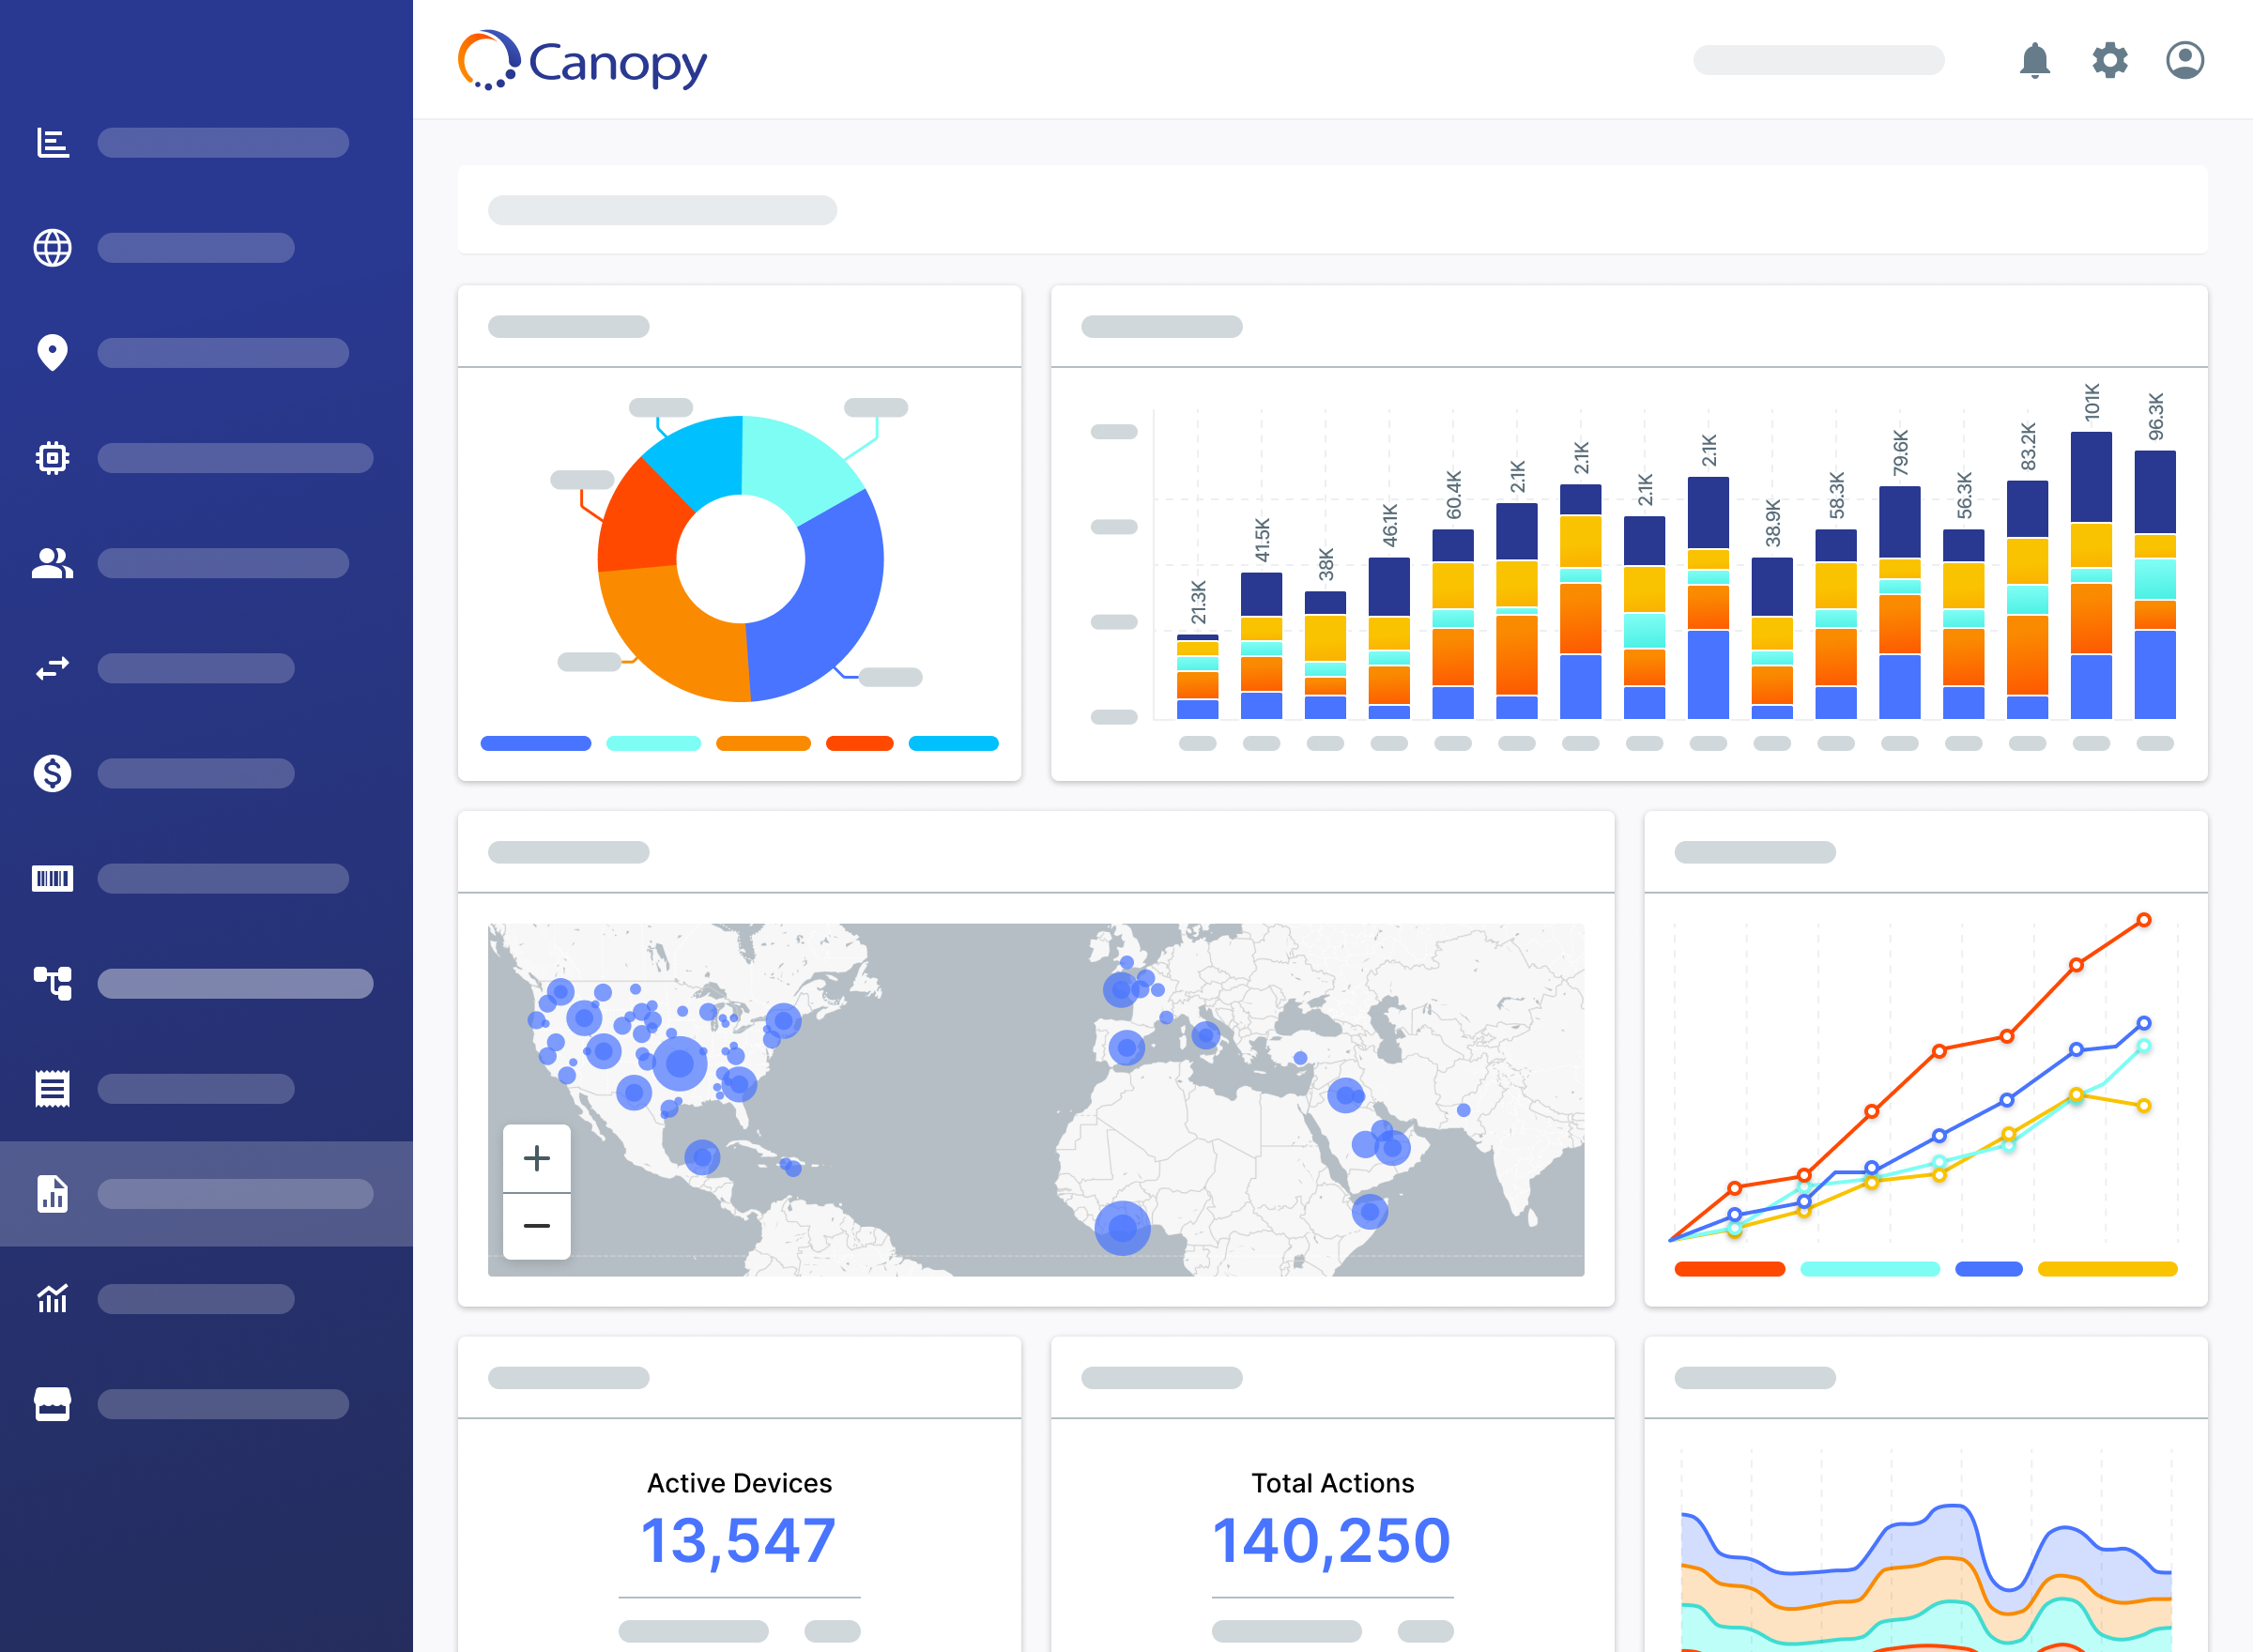
Gain valuable insights into device uptime and performance trends with Canopy's analytical capabilities, empowering you to make data driven decisions and drive your product roadmap.
Give your customers a full report demonstrating how you are delivering superior uptime.


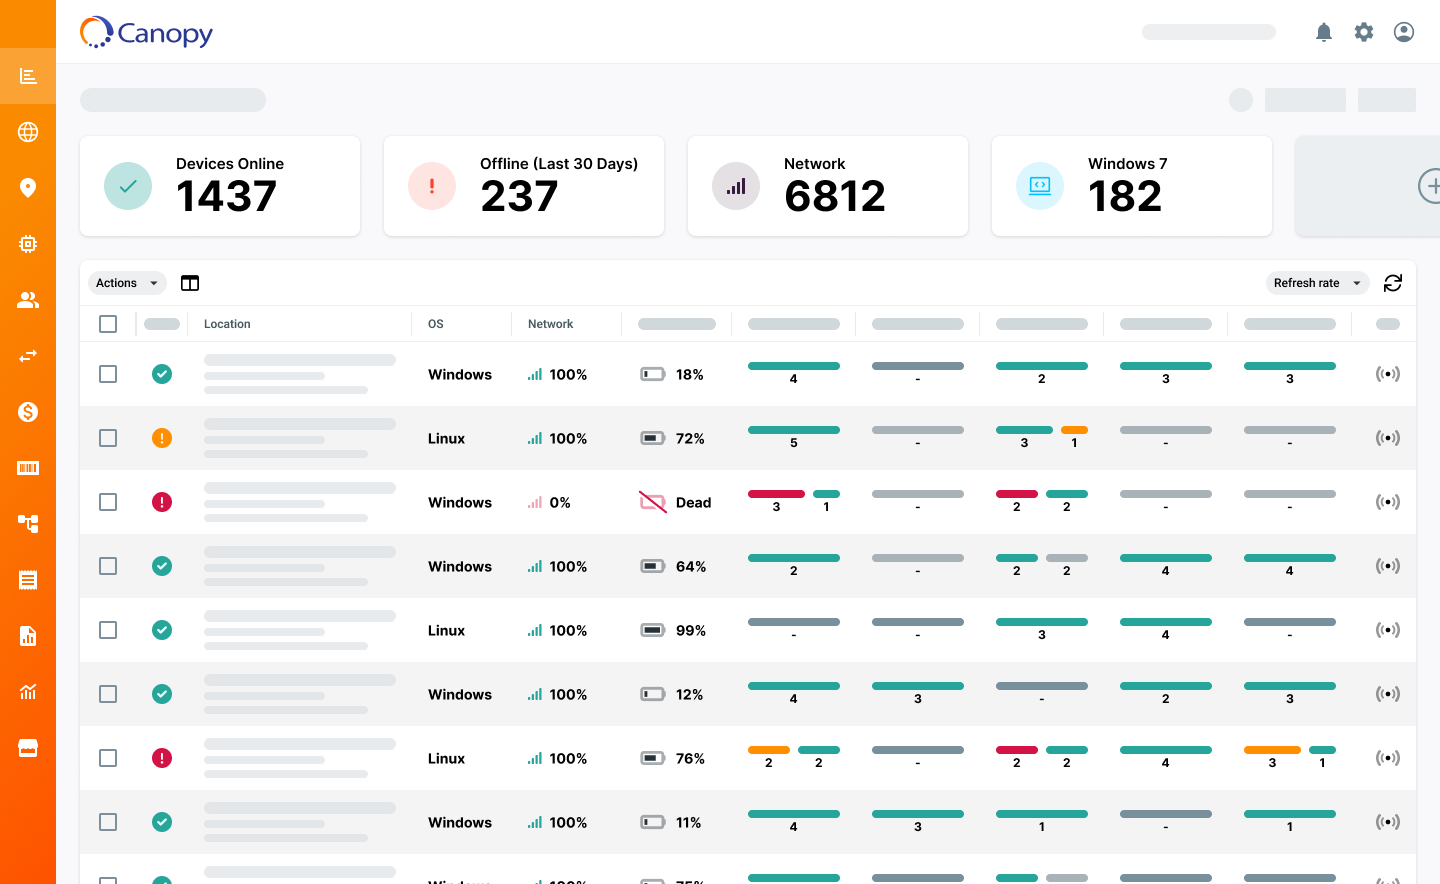
Measure the unique health and performance data collected by Canopy over historical periods to spot trends and identify downtime root causes.

Leverage Canopy's stock reports for daily, weekly or monthly tracking of availability SLA adherence. Automated report distribution can be used for internal or customer facing use cases.

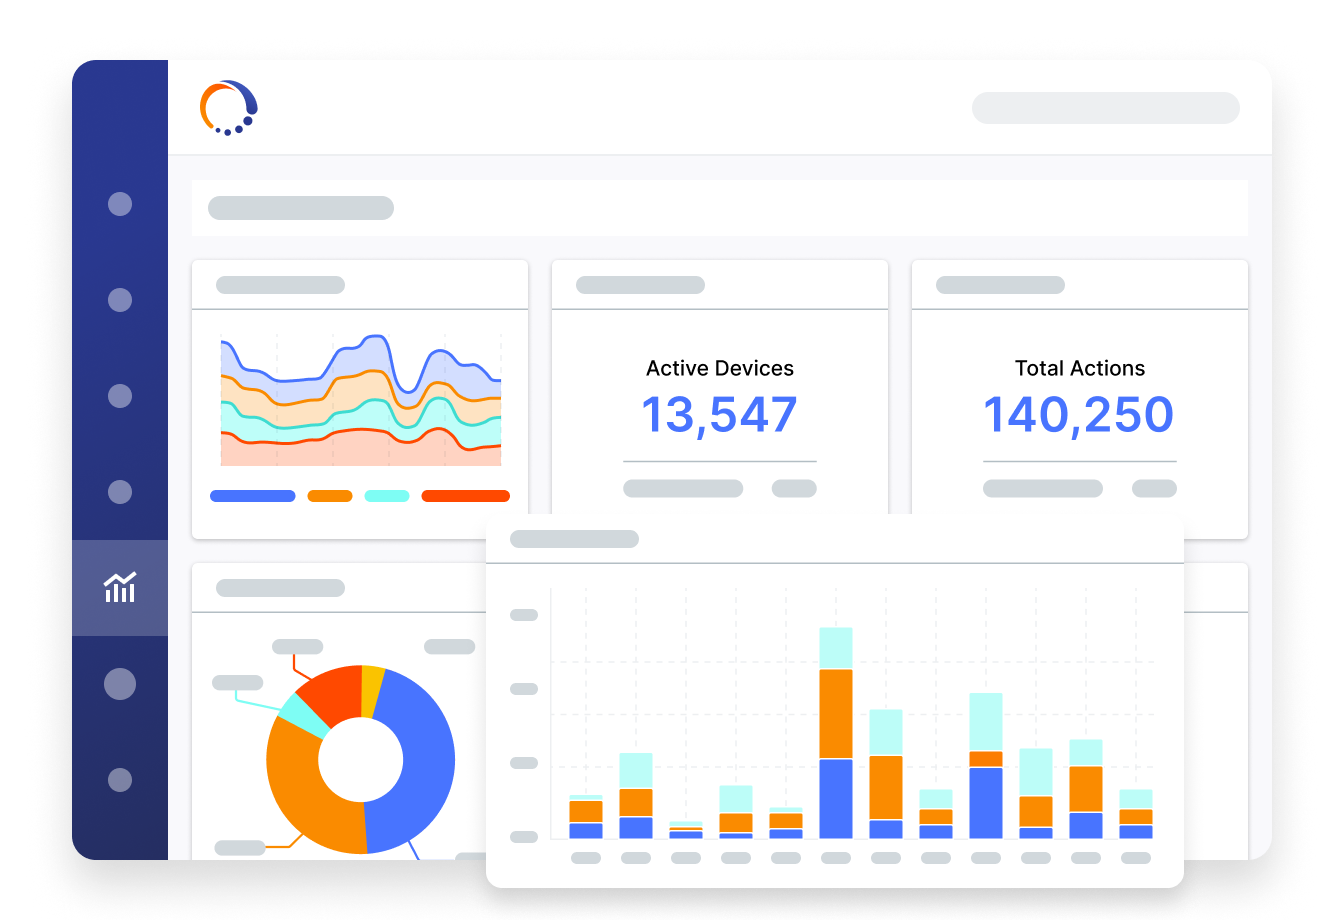
Build customized analytics dashboards to suit the way you think about your business and Issue Root-Cause Identification.

Use Canopy's granular analytics tool to evaluate solution performance and identify areas for hardware or software improvements. Make data-driven decisions on how to optimize better performance.
Use Canopy Analytics to view any attributes, actions, or other data historically over time to track performance of your solution and pinpoint potential hardware or software enhancements. Gain actionable insights that better help you understand how to optimize your fleet.
With Canopy, generate and export reports to make data-informed decisions and identify patterns or anomalies that could impact future strategies. Additionally, reports can be automatically generated and sent to your team or customers.

Plug and play your devices with Canopy Analytics and automatically get provided Canned Reports, Analytics Dashboards, and other templates to cut down on reporting time.

Yes, Canopy can take data extracted from the device and point it at third party reporting or dashboard applications your team is already using.
Excel, CSV, and PDF
See why our customers love Canopy