How Canopy Tailors RMM for Connected Products
In the dawning era of Connected Products, Canopy has built an RMM platform flexible and powerful enough to support custom smart hardware in a truly standard way.
Intro to RMM for Connected Products
Traditional Remote Monitoring and Management (RMM) software tools have been very effective for remotely managing workplace and IT environments, but often fall short when managing Connected Product ecosystems (e.g., self-service kiosks, smart lockers, access control and camera systems, etc.). And as more Connected Products and IoT solutions come to market, the demand for more specialized remote device management capabilities has increased exponentially.
For a more detailed explanation on the difference between Connected Product and IT infrastructure, check out our prior posts on RMM for Connected Products vs RMM for IT Infrastructure and Navigating the RMM Landscape. In this article, we will discuss the core RMM capabilities that are required to remotely manage Connected Product solutions and relevant examples from our experience at Canopy.
Flexible Connectivity Options and Configurable KPIs
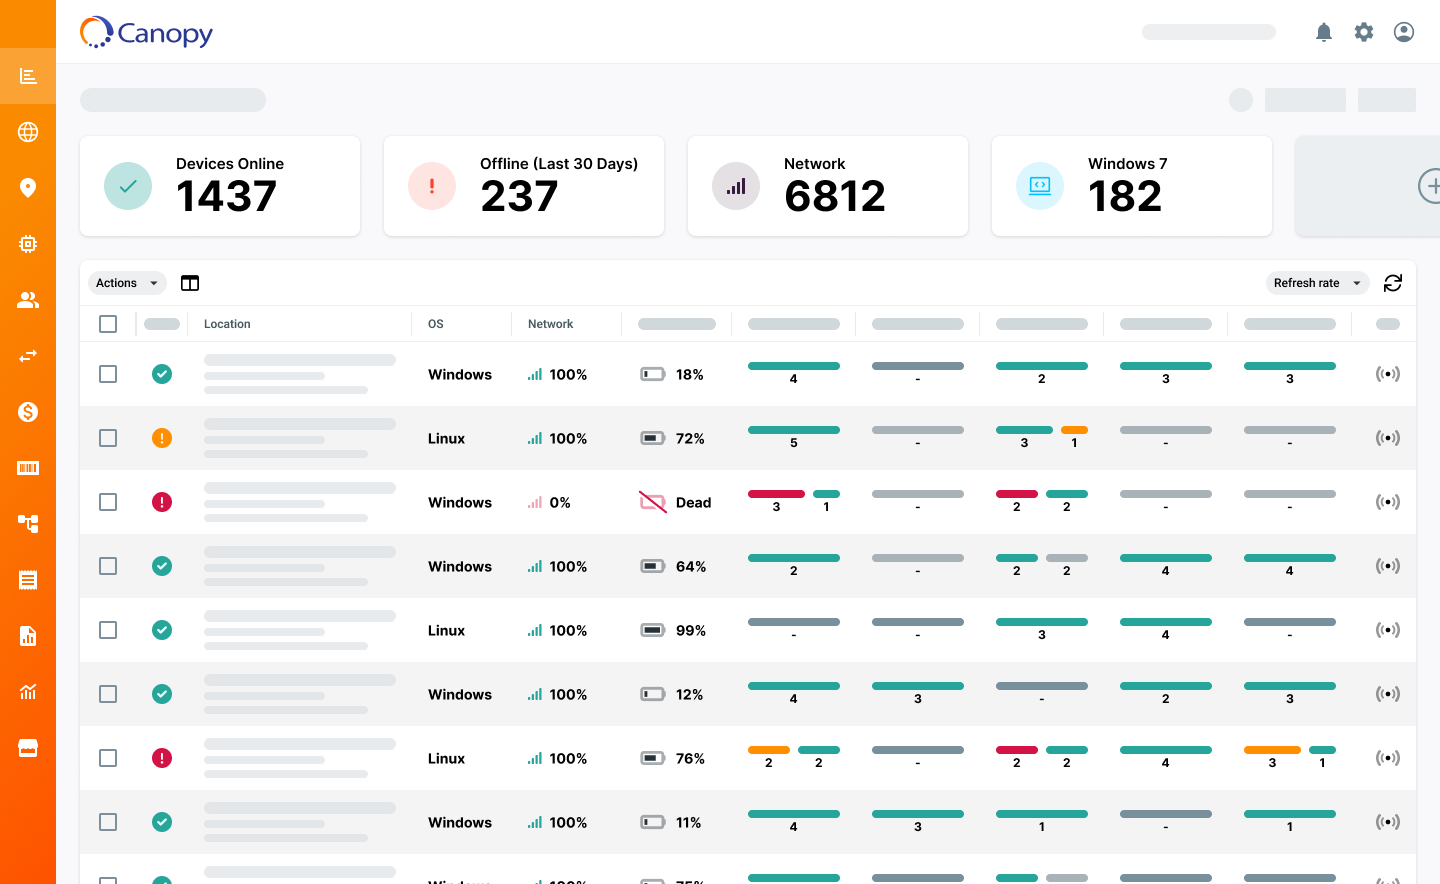
The core of an effective RMM solution is its ability to provide real-time metrics and actionable insights that are specific to the Connected Product being monitored. This starts with the ability to connect to a variety of hardware, software, backend / ticketing systems, and other key datasets that make up the Connected Product ecosystem. Whether it’s deploying a software agent that runs natively on devices at the edge, connecting via other device protocols like MQTT, API, SNMP, ICMP Ping, etc. or integrating software application data, the ability to flexibly integrate across data categories is critical to fully manage a Connected Product ecosystem remotely.
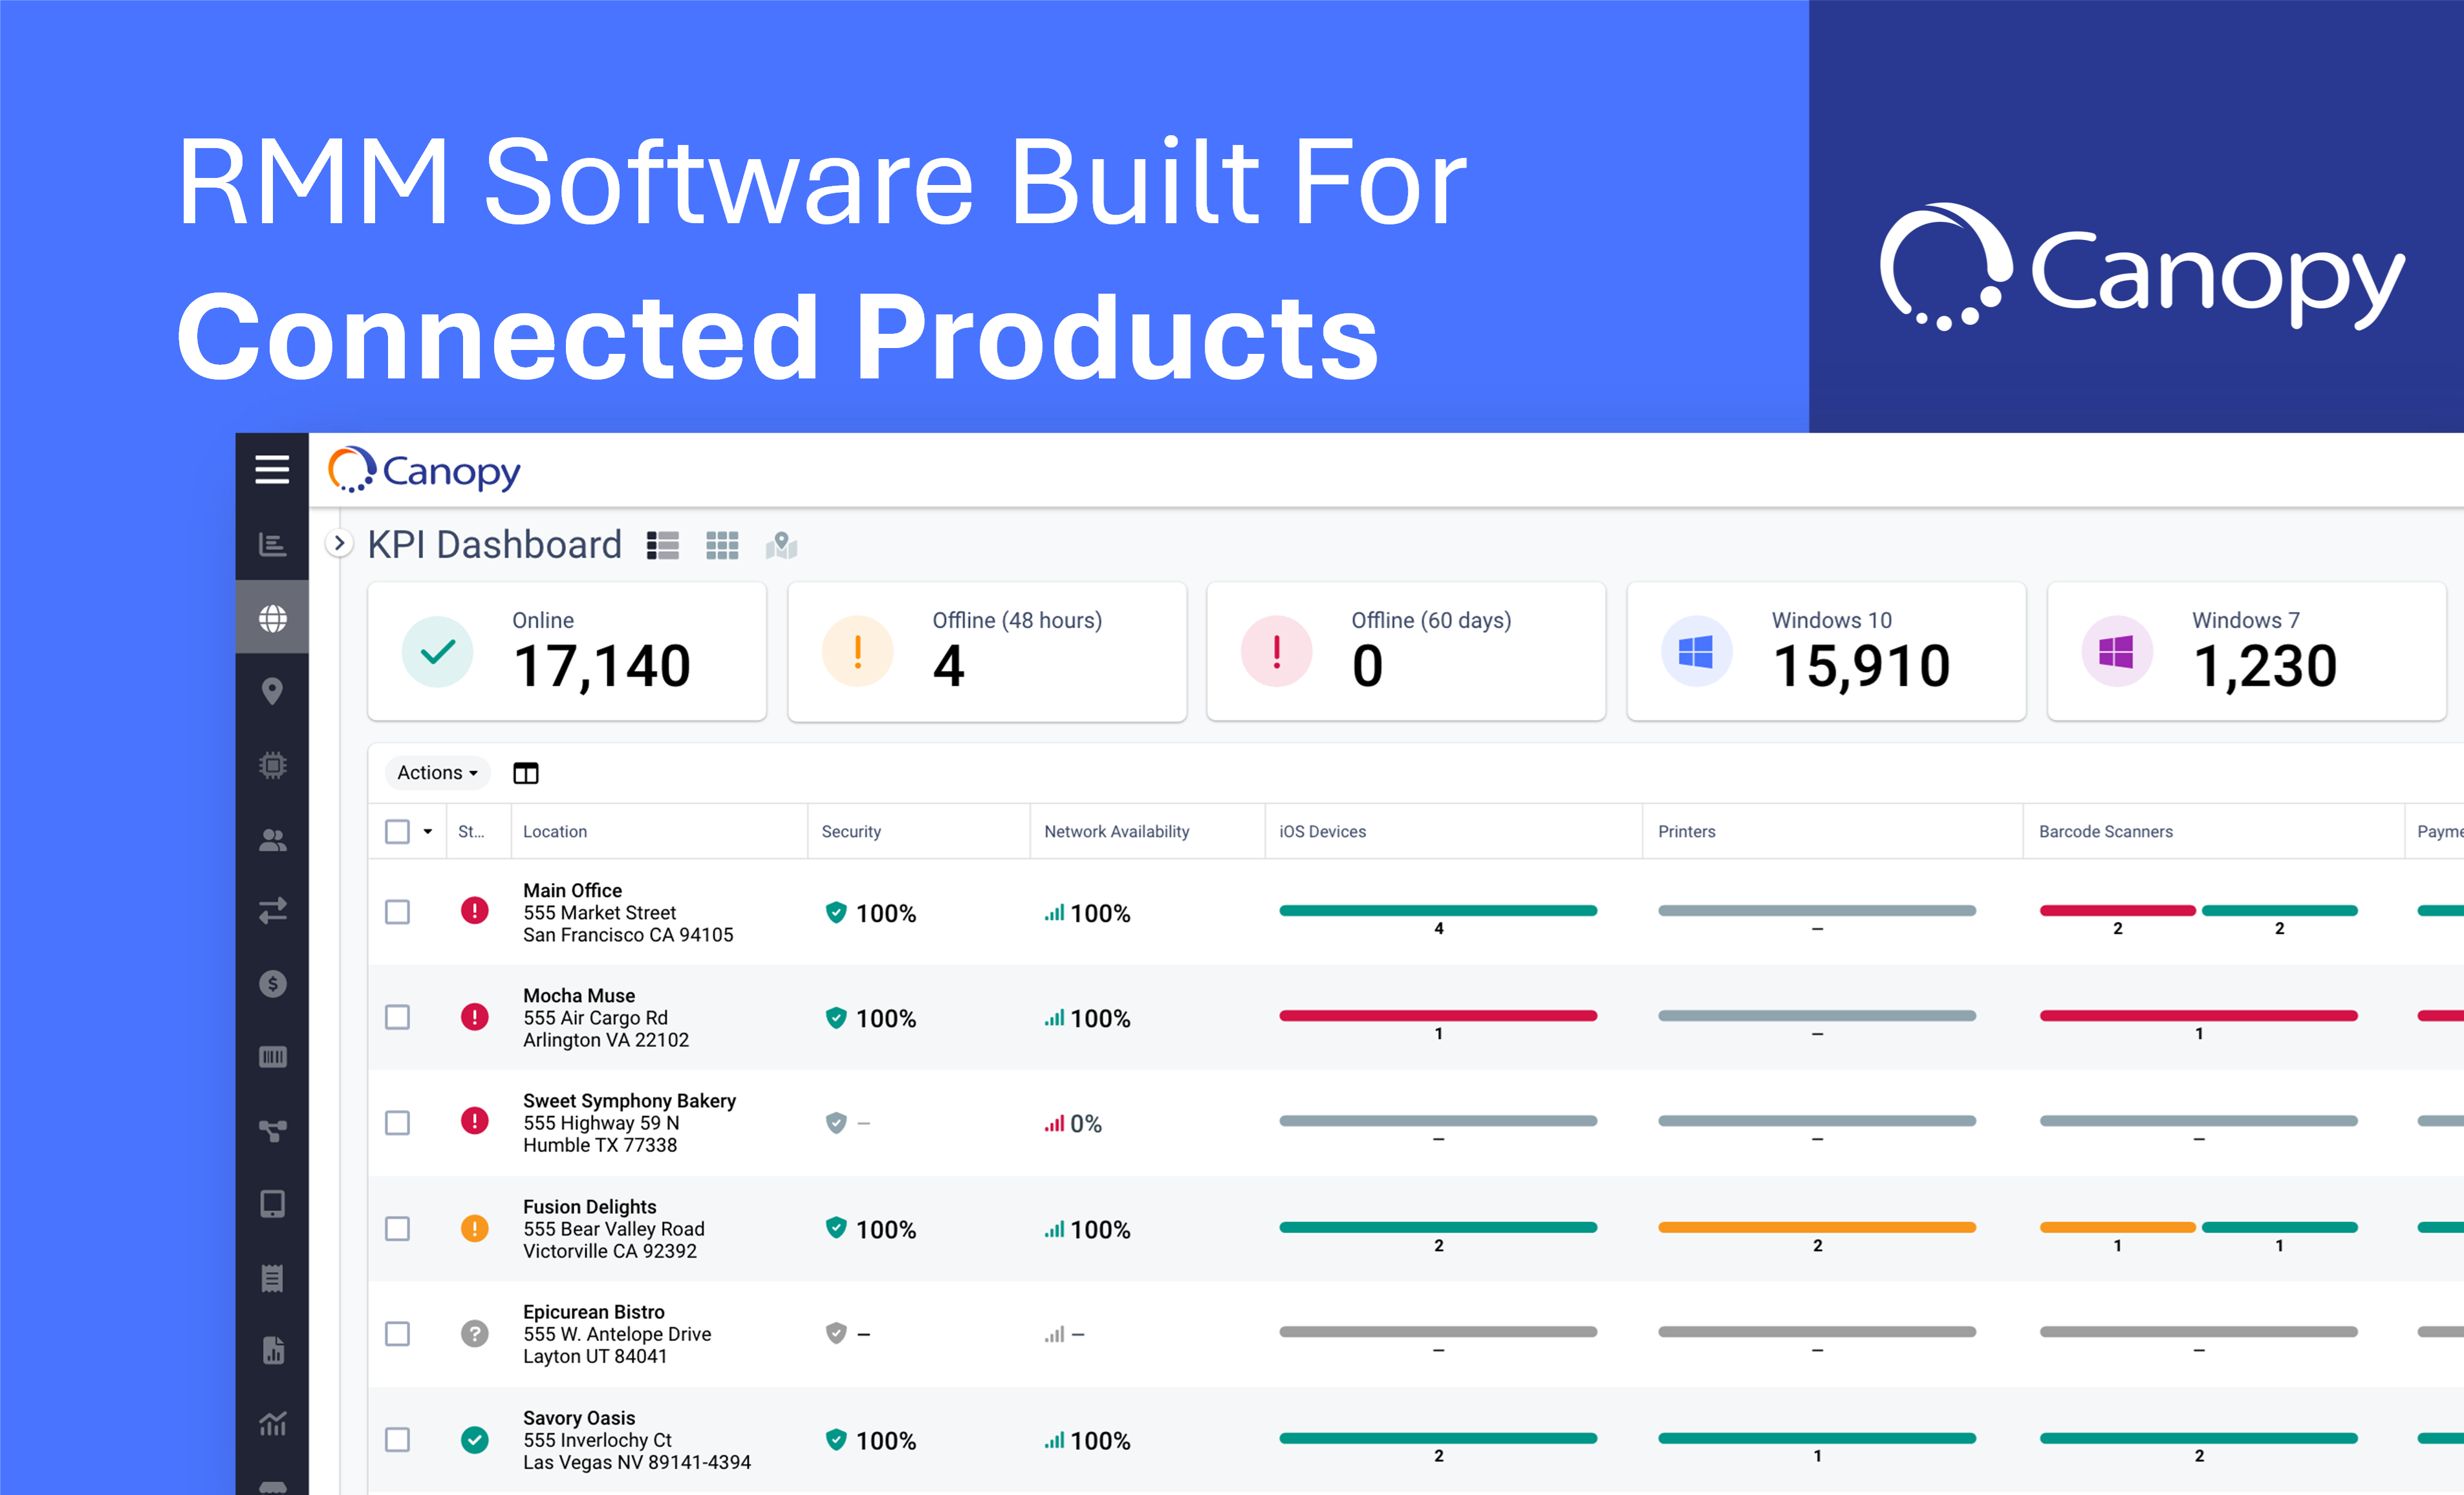
Once connected, bringing actionable insights to life from your data means configurable dashboards and KPIs that can be customized to the unique operations of each deployment. Customized KPIs enable businesses to create metrics that directly impact their availability, such as hardware health, software health, incorporating business data / consumer interactions, and ultimately expose the total solution uptime. These KPI dashboards not only offer a snapshot of current performance but also feed predictive analytics to forecast potential issues before they impact uptime.
Examples of Customized Health KPIs Inside Canopy
At Canopy, we enjoy working with our customers and partners to integrate to Connected Products and deploy actionable insights that matter for each unique solution. For fun, we’ve included a few examples of some unique KPIs below:
Kiosk Transaction KPI: using hardware data and software application-level data, Canopy tracks a rolling 24-hour KPI that calculates i) number of successful kiosk transactions, ii) number of kiosk transactions that failed (e.g., credit card reader failure, item not available, etc.), and iii) number of times the locker door was not shut after transaction. This KPI enables our customer to uniquely track kiosk transactions, identify any transaction related issues, and ensure their consumer experience is optimized.
Predictive Health KPI: an industrial manufacturing customer uses device data and a linear regression analysis integration to project energy usage over a 24-hour period. This KPI is set up with alert parameters that proactively warn of upcoming overages, allowing our customer to efficiently track energy usage of their equipment and avoid over-heating the Connected Product.
Software License Management KPI: in addition to monitoring the health of their Windows server and peripheral hardware, one customer uses Canopy to track software license versions. They incorporate business logic to track license purchases and warn their team about licenses that are about to expire.
Network Health KPI: in the world of video streaming, network health is a critical factor that impacts uptime. This customer uses Canopy to track download bandwidth, upload bandwidth, jitter, latency, packet loss and other metrics tied to network performance. Together, this data is calculated into a KPI that allows their Network Operations Center (NOC) to proactively identify sites with network issues and quickly understand the granular root cause of streaming performance issues.
Automated Workflows to Streamline Remote Management Operations
While connectivity and configurable real-time KPIs are critical, flexibility in remote device management extends beyond monitoring. The ability to perform remote actions and automate workflows is crucial for maintaining the health and efficiency of Connected Products. The ability for technical support teams and managed service providers to define and execute a wide range of remote actions — from firmware updates to peripheral device resets to deploying custom scripts — directly from the dashboard is critical to minimizing onsite truck rolls and reducing downtime.
Moreover, the ability to create automated workflows that can trigger based on specific data events, product statuses, or device state changes is another core requirement to remotely managing device ecosystems at the edge. This feature is invaluable for maintaining service quality, responding to issues in real-time, and solving unique uptime challenges in each Connected Product environment – without the need for repeated manual intervention.
Device Management Workflows that Canopy Automates
Like the above KPI examples, we’ve identified some automated workflow examples from Canopy’s Automation Engine below.
Data Usage Alerting: through an API integration, Canopy tracks cellular data usage in real-time and alerts this customer when their digital signage product is close to exceeding its data plan. If the signage solution is close to an overage, Canopy takes automated actions to minimize data usage and avoid the overage – driving significant cost savings for the customer from their cellular providers.
Automated Self-Healing Actions: for a self-service kiosk operating outdoors, Canopy monitors temperature data. When the temperature gets too hot, a custom temperature KPI changes to “red” and triggers an automation to turn on power to the AC unit inside the kiosk. This custom KPI prevents damage to kiosk, ultimately reducing onsite technician visits and decreasing downtime.
Automated Root Cause Detection: When an issue occurs, Canopy automatically pulls data from this customer’s Elastic environment to expose and analyze system event logs. This provides our customer’s technical support team with quick access to root the cause of the access control product’s uptime issues.
Automated Ticket Creation and Dispatch: Unfortunately, not all issues can be resolved remotely. When this occurs Canopy automatically creates a support ticket summarizing the remote recovery steps that were taken and any key information about the device. From there, based on the issue type, the team can quickly dispatch a technician to the scene.
Intelligent Data Reporting and Analytics with Canopy
With the appropriate KPIs and monitoring in place as well as the ability to action these insights from the edge in real-time and remotely, remote device operators are well on their way to reducing downtime. However, to optimize product and support processes, you will need powerful data reporting and analytics. With the complexity of a Connected Product or sophisticated device operating at the edge, the volume of data generated can be immense. Efficiently managing and extracting actionable insights from this data is paramount.
Canopy's data reporting and analytics capabilities are designed to handle the scale and complexity of any Connected Product’s dataset. Leveraging data events from all aspects of the solution ecosystem and the correct KPIs, Canopy provides tools for aggregating data across devices, performing trend analysis, and generating detailed reports that inform business decisions. With these capabilities and appropriate configuration, product teams can identify software bugs or other product issues and support teams can identify usage patterns and uncover additional opportunities for automating support processes.
Streamlining Your Remote Device Management Operations with Canopy
The unique demands of Connected Products and other remote device ecosystems require RMM software that offers a high degree of flexibility coupled with robust functionality. Through i) configurable KPIs and dashboards, ii) customizable remote actions and automation workflows, and iii) the ability to feed comprehensive data reporting and analytics, Canopy empowers businesses to uniquely monitor, manage, and optimize their Connected Products. As the Connected Product landscape continues to evolve, flexibility and adaptability of RMM tools will be key to unlocking the full potential of these complex solutions.
We’d love the opportunity to hear directly from you! What KPI or monitoring metric matters most to your business and Connected Product? How about a unique support process that you’d like to automate, or data set you need to capture and expose at your team’s fingertips? To get in touch and see if Canopy makes sense for your Connected Product solution, reach out via our website.